This article will describe analyzing boot time.
Table of Contents
1 kernel (printk's timestamp)
printk is a log function in kernel. When CONFIG_PRINTK_TIME is enabled, printk has a timestamp.
Because CONFIG_PRINTK_TIME is enabled by default on Ubuntu 16.04, you can analyze kernel boot time with printk's timestamp.
$ dmesg
<snip>
[    1.848747] virtio_net virtio0 ens3: renamed from eth0
[    1.868691] input: VirtualPS/2 VMware VMMouse as
/devices/platform/i8042/serio1/input/input4
[    1.873850] input: VirtualPS/2 VMware VMMouse as
/devices/platform/i8042/serio1/input/input3
[    1.883397] FDC 0 is a S82078B
[    2.272250] EXT4-fs (dm-0): mounted filesystem with ordered data
mode. Opts: (null)
<snip>
2 initrd (/dev/kmsg)
When starting initrd, root filesystem is not mounted yet. syslogd and journald is not running yet. It is difficult to save initrd's log to userspace.
This article will redirect initrd's stdout to /dev/kmsg and save initrd's log to printk's buffer.
Take a backup of initrd.
$ version=$(uname -r)
$ sudo cp /boot/initrd.img-${version} /boot/initrd.img-${version}.org
Move original init script to scripts directory.
$ sudo mv /usr/share/initramfs-tools/init \
     /usr/share/initramfs-tools/scripts/init
Create new init script.
- /dev will be used by original init script. Create /printk directory and mount devtmpfs to /printk.
- Execute /script/init and redirect stdout to /printk/kmsg.
- busybox's ash cannot write stderr to /dev/kmsg. /bin/sh -x cannot be done.
- busybox's hush can write stderr to /dev/kmsg. But original init script cannot be completed.
$ cat <<EOF | sudo tee /usr/share/initramfs-tools/init
#!/bin/sh
mkdir -p /printk
mount -t devtmpfs -o nosuid,mode=0755 udev /printk
exec /bin/sh /scripts/init > /printk/kmsg
EOF
$ sudo chmod a+x /usr/share/initramfs-tools/init
Update initrd and reboot Ubuntu 16.04.
$ sudo update-initramfs -u
$ sudo reboot
dmesg's output is as below after reboot.
$ dmesg
<snip>
[    1.563504] Write protecting the kernel read-only data: 14336k
[    1.565144] Freeing unused kernel memory: 1824K (ffff880001838000 -
ffff880001a00000)
[    1.566810] Freeing unused kernel memory: 152K (ffff880001dda000 -
ffff880001e00000)
[    1.570844] Loading, please wait...
[    1.577172] random: udevadm: uninitialized urandom read (16 bytes
read, 2 bits of entropy available)
[    1.578679] random: udevadm: uninitialized urandom read (16 bytes
read, 2 bits of entropy available)
[    1.580151] random: udevadm: uninitialized urandom read (16 bytes
read, 2 bits of entropy available)
[    1.581989] random: systemd-udevd: uninitialized urandom read (16
bytes read, 2 bits of entropy available)
[    1.583496] random: systemd-udevd: uninitialized urandom read (16
bytes read, 2 bits of entropy available)
[    1.584940] random: systemd-udevd: uninitialized urandom read (16
bytes read, 2 bits of entropy available)
[    1.586417] random: systemd-udevd: uninitialized urandom read (16
bytes read, 2 bits of entropy available)
[    1.588545] random: udevadm: uninitialized urandom read (16 bytes
read, 2 bits of entropy available)
[    1.590054] random: udevadm: uninitialized urandom read (16 bytes
read, 2 bits of entropy available)
[    1.591477] random: udevadm: uninitialized urandom read (16 bytes
read, 2 bits of entropy available)
[    1.634014] virtio_net virtio0 ens3: renamed from eth0
[    1.644640] input: VirtualPS/2 VMware VMMouse as
/devices/platform/i8042/serio1/input/input4
[    1.646164] input: VirtualPS/2 VMware VMMouse as
/devices/platform/i8042/serio1/input/input3
[    1.669312] FDC 0 is a S82078B
[    1.688616] Begin: Loading essential drivers ... done.
[    1.689657] Begin: Running /scripts/init-premount ... done.
[    1.692942] Begin: Mounting root file system ... Begin: Running
/scripts/local-top ... done.
[    1.947036] Begin: Running /scripts/local-premount ... done.
[    1.965256] Begin: Will now check root file system ...
[    1.969435] fsck from util-linux 2.27.1
[    1.975002] [/sbin/fsck.ext4 (1) -- /dev/mapper/ubuntu--vg-root]
fsck.ext4 -a -C0 /dev/mapper/ubuntu--vg-root
[    1.997830] /dev/mapper/ubuntu--vg-root: clean, 275895/5152768
files, 1845138/20583424 blocks
[    2.027183] done.
[    2.035616] EXT4-fs (dm-0): mounted filesystem with ordered data
mode. Opts: (null)
[    2.037986] done.
[    2.068452] Begin: Running /scripts/local-bottom ... done.
[    2.072004] Begin: Running /scripts/init-bottom ... done.
[    2.333182] clocksource: tsc: mask: 0xffffffffffffffff max_cycles:
0x30e602f0f5d, max_idle_ns: 440795236409 ns
[    3.140509] systemd[1]: systemd 229 running in system mode. (+PAM
+AUDIT +SELINUX +IMA +APPARMOR +SMACK +SYSVINIT +UTMP +LIBCRYPTSETUP
+GCRYPT +GNUTLS +ACL +XZ -LZ4 +SECCOMP +BLKID +ELFUTILS +KMOD -IDN)
[    3.146419] systemd[1]: Detected virtualization kvm.
[    3.148571] systemd[1]: Detected architecture x86-64.
<snip>
initrd's log is between "[ 1.570844] Loading, please wait…" with "[ 2.072004] Begin: Running /scripts/init-bottom … done.".
If you need more detailed log, you need to add echo statement to scripts in /usr/share/initramfs-tools.
3 userspace (systemd-analyze)
systemd-analyze provides boot time of kernel, initrd and systemd. This is the replacement package of bootchart.
Boot time of initrd is included in boot time of kernel on Ubuntu 16.04.
$ systemd-analyze
Startup finished in 2.002s (kernel) + 2.067s (userspace) = 4.069s
"systemd-analyze blame" outputs units by consumed time.
$ systemd-analyze blame
           675ms lvm2-monitor.service
           644ms console-setup.service
           629ms dev-mapper-ubuntu\x2d\x2dvg\x2droot.device
           436ms networking.service
           416ms accounts-daemon.service
           274ms grub-common.service
           244ms alsa-restore.service
           239ms gpu-manager.service
           238ms apport.service
           235ms irqbalance.service
<snip>
"systemd-analyze critical-chain" output unit path which consumes the most time. @ means start time and + means consuming time. graphical.target is leaf node and .slice is root node.
But systemd is running in parallel, if you shorten 500ms from this path, userspace might not be shortened 500ms.
$ systemd-analyze critical-chain
The time after the unit is active or started is printed after the "@" character.
The time the unit takes to start is printed after the "+" character.

graphical.target @2.015s
'─multi-user.target @2.013s
  '─getty.target @2.012s
    '─getty@tty1.service @2.009s
      '─rc-local.service @1.845s +43ms
        '─network.target @1.843s
          '─NetworkManager.service @1.659s +177ms
<snip>
                                    '─lvm2-lvmetad.service @340ms
                                      '─system.slice @142ms
                                        '─-.slice @80ms
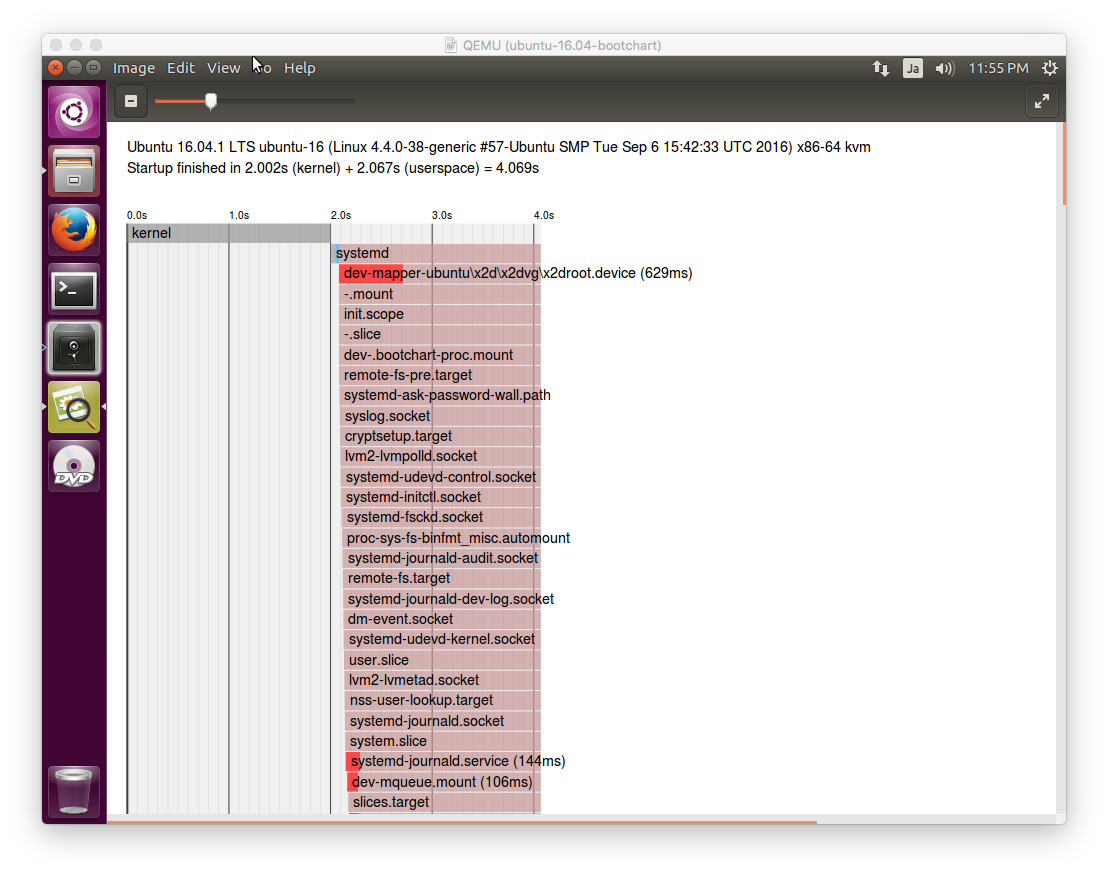
"sykstemd-analyze plot" outputs plot as svg file. This helps you to understand overall userspace.
$ systemd-analyze plot > a.svg