Ubuntu 16.04の起動時間の測定方法をまとめました。
Table of Contents
1 kernel (printkのタイムスタンプ)
printkはカーネル内で使われるログ出力関数です。CONFIG_PRINTK_TIMEが有効な場合、ログにタイムスタンプが付与されます。
UbuntuではデフォルトでCONFIG_PRINTK_TIMEが有効なので、カーネルの起動時間をprintkのタイムスタンプで確認できます。
$ dmesg
<snip>
[    1.848747] virtio_net virtio0 ens3: renamed from eth0
[    1.868691] input: VirtualPS/2 VMware VMMouse as
/devices/platform/i8042/serio1/input/input4
[    1.873850] input: VirtualPS/2 VMware VMMouse as
/devices/platform/i8042/serio1/input/input3
[    1.883397] FDC 0 is a S82078B
[    2.272250] EXT4-fs (dm-0): mounted filesystem with ordered data
mode. Opts: (null)
<snip>
2 initrd (/dev/kmsg)
initrdが動作している段階では、ルートファイルシステムはマウントされておらず、syslogdやjournaldもまだ動いていないのでuserspaceにログを残すのは難しいです。
そこでinitrdの標準出力を/dev/kmsgに書き込み、printkのバッファにログを残すようにします。
initrdのバックアップをとっておきます。
$ version=$(uname -r)
$ sudo cp /boot/initrd.img-${version} /boot/initrd.img-${version}.org
initrdのinitをscripts配下に移動します。
$ sudo mv /usr/share/initramfs-tools/init \
     /usr/share/initramfs-tools/scripts/init
新たなinitを作成します。
- /devはinitの延長でマウントされるので/printkというディレクトリを作成し、devtmpfsをマウントします。
- /scripts/initを実行し、/printk/kmsgに標準出力をリダイレクトします。
- busyboxのashは標準エラー出力を/dev/kmsgに書き込めないので、-xオプションは利用できません。
- busyboxのhushは書き込めるが、initrdのinitがうまく動作しません。
$ cat <<EOF | sudo tee /usr/share/initramfs-tools/init
#!/bin/sh
mkdir -p /printk
mount -t devtmpfs -o nosuid,mode=0755 udev /printk
exec /bin/sh /scripts/init > /printk/kmsg
EOF
$ sudo chmod a+x /usr/share/initramfs-tools/init
initrdを作成します。
$ sudo update-initramfs -u
$ sudo reboot
再起動後のdmesgの結果は以下の通りです。
$ dmesg
<snip>
[    1.563504] Write protecting the kernel read-only data: 14336k
[    1.565144] Freeing unused kernel memory: 1824K (ffff880001838000 -
ffff880001a00000)
[    1.566810] Freeing unused kernel memory: 152K (ffff880001dda000 -
ffff880001e00000)
[    1.570844] Loading, please wait...
[    1.577172] random: udevadm: uninitialized urandom read (16 bytes
read, 2 bits of entropy available)
[    1.578679] random: udevadm: uninitialized urandom read (16 bytes
read, 2 bits of entropy available)
[    1.580151] random: udevadm: uninitialized urandom read (16 bytes
read, 2 bits of entropy available)
[    1.581989] random: systemd-udevd: uninitialized urandom read (16
bytes read, 2 bits of entropy available)
[    1.583496] random: systemd-udevd: uninitialized urandom read (16
bytes read, 2 bits of entropy available)
[    1.584940] random: systemd-udevd: uninitialized urandom read (16
bytes read, 2 bits of entropy available)
[    1.586417] random: systemd-udevd: uninitialized urandom read (16
bytes read, 2 bits of entropy available)
[    1.588545] random: udevadm: uninitialized urandom read (16 bytes
read, 2 bits of entropy available)
[    1.590054] random: udevadm: uninitialized urandom read (16 bytes
read, 2 bits of entropy available)
[    1.591477] random: udevadm: uninitialized urandom read (16 bytes
read, 2 bits of entropy available)
[    1.634014] virtio_net virtio0 ens3: renamed from eth0
[    1.644640] input: VirtualPS/2 VMware VMMouse as
/devices/platform/i8042/serio1/input/input4
[    1.646164] input: VirtualPS/2 VMware VMMouse as
/devices/platform/i8042/serio1/input/input3
[    1.669312] FDC 0 is a S82078B
[    1.688616] Begin: Loading essential drivers ... done.
[    1.689657] Begin: Running /scripts/init-premount ... done.
[    1.692942] Begin: Mounting root file system ... Begin: Running
/scripts/local-top ... done.
[    1.947036] Begin: Running /scripts/local-premount ... done.
[    1.965256] Begin: Will now check root file system ...
[    1.969435] fsck from util-linux 2.27.1
[    1.975002] [/sbin/fsck.ext4 (1) -- /dev/mapper/ubuntu--vg-root]
fsck.ext4 -a -C0 /dev/mapper/ubuntu--vg-root
[    1.997830] /dev/mapper/ubuntu--vg-root: clean, 275895/5152768
files, 1845138/20583424 blocks
[    2.027183] done.
[    2.035616] EXT4-fs (dm-0): mounted filesystem with ordered data
mode. Opts: (null)
[    2.037986] done.
[    2.068452] Begin: Running /scripts/local-bottom ... done.
[    2.072004] Begin: Running /scripts/init-bottom ... done.
[    2.333182] clocksource: tsc: mask: 0xffffffffffffffff max_cycles:
0x30e602f0f5d, max_idle_ns: 440795236409 ns
[    3.140509] systemd[1]: systemd 229 running in system mode. (+PAM
+AUDIT +SELINUX +IMA +APPARMOR +SMACK +SYSVINIT +UTMP +LIBCRYPTSETUP
+GCRYPT +GNUTLS +ACL +XZ -LZ4 +SECCOMP +BLKID +ELFUTILS +KMOD -IDN)
[    3.146419] systemd[1]: Detected virtualization kvm.
[    3.148571] systemd[1]: Detected architecture x86-64.
<snip>
"[ 1.570844] Loading, please wait…"から"[ 2.072004] Begin: Running /scripts/init-bottom … done."までがinitrdの標準出力とinitrdの延長で呼ばれるカーネル空間のログです。
より細かいログが必要な場合は/usr/share/initramfs-tools配下のスクリプトにecho文を追加してください。
3 userspace (systemd-analyze)
systemd-analyzeはカーネル、initrd、systemdの処理時間を測定できます。以前はbootchartが使われていましたが、現在はsystemdに最初から組み込まれているsystemd-analyzeを用いるべきです。
Ubuntu 16.04の場合はinitrdの処理時間はkernelに含まれます。
$ systemd-analyze
Startup finished in 2.002s (kernel) + 2.067s (userspace) = 4.069s
systemd-analyze blameで処理に時間が掛かるunitを表示できます。
$ systemd-analyze blame
           675ms lvm2-monitor.service
           644ms console-setup.service
           629ms dev-mapper-ubuntu\x2d\x2dvg\x2droot.device
           436ms networking.service
           416ms accounts-daemon.service
           274ms grub-common.service
           244ms alsa-restore.service
           239ms gpu-manager.service
           238ms apport.service
           235ms irqbalance.service
<snip>
systemd-analyze critical-chainで一番時間が掛かっている経路を出力できます。@は開始時刻で、+は開始するのに掛かった時間です。graphical.targetが一番下の子ノード、.sliceが一番上の親ノードとなります。
systemdは並列に動作している為、この経路で500ms短くしたとしても、全体として500ms短くなるとは限りません。
$ systemd-analyze critical-chain
The time after the unit is active or started is printed after the "@" character.
The time the unit takes to start is printed after the "+" character.

graphical.target @2.015s
└─multi-user.target @2.013s
  └─getty.target @2.012s
    └─getty@tty1.service @2.009s
      └─rc-local.service @1.845s +43ms
        └─network.target @1.843s
          └─NetworkManager.service @1.659s +177ms
<snip>
                                    └─lvm2-lvmetad.service @340ms
                                      └─system.slice @142ms
                                        └─-.slice @80ms
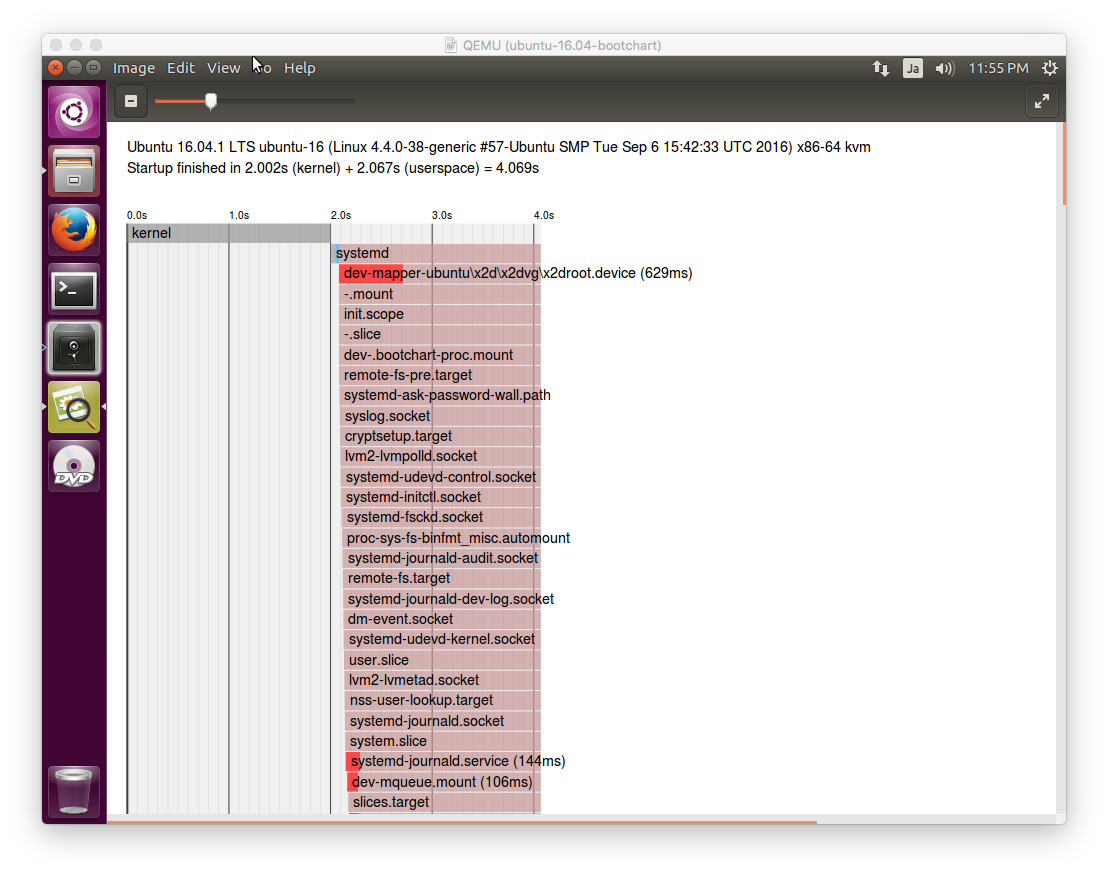
systemd-analyze plotですべてのunitをsvg形式で出力します。こちらは全体的な処理の流れを把握するのに有効です。
$ systemd-analyze plot > a.svg